
⚡ Quick Answer: How Should Digital Marketers Interpret TRAI Reports?
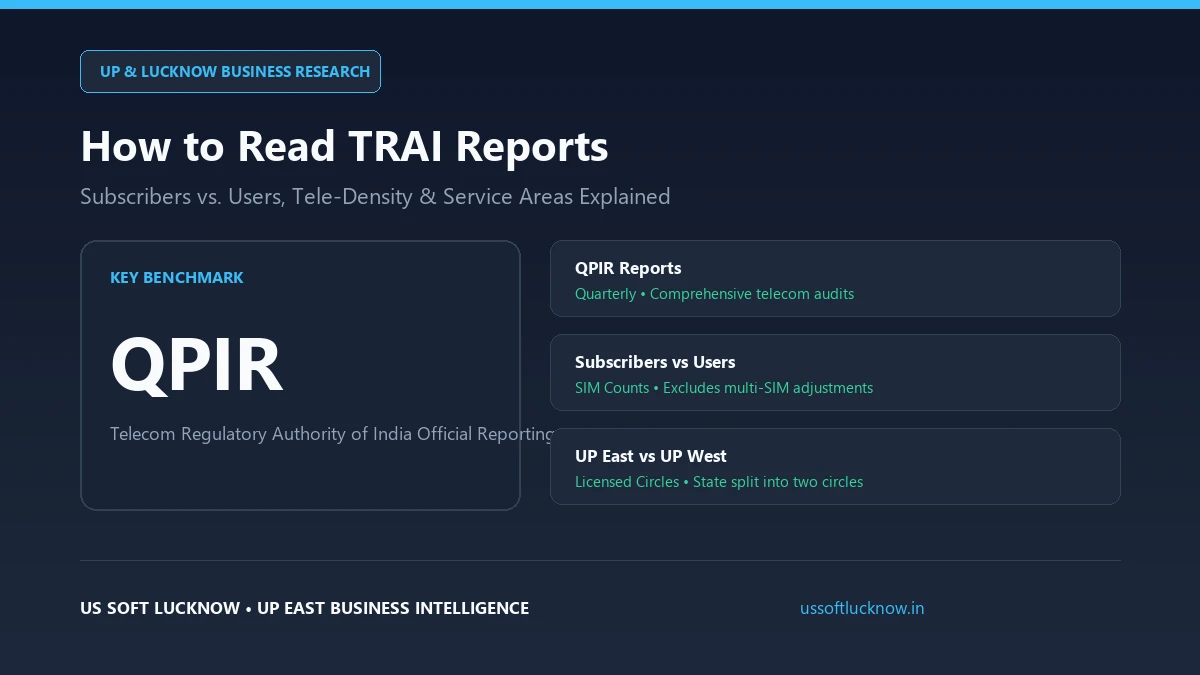
The Telecom Regulatory Authority of India (TRAI) publishes two primary datasets: monthly Press Releases (snapshot SIM counts) and the exhaustive Quarterly Performance Indicators Report (QPIR). Marketers must recognize three critical distinctions: (1) Subscribers measure active SIM connections, not individual humans, (2) Tele-density measures SIMs per 100 population, not internet penetration, and (3) TRAI reports data by 22 licensed telecom circles (e.g. UP East / UP West), never by municipal cities.
Authoritative data is the backbone of persuasive marketing, business pitches, and corporate presentations. However, marketing professionals frequently misquote TRAI statistics, embarrassing themselves in front of investors and clients.
To see TRAI data applied correctly in macro analysis, explore our research on India Internet Users 2026: TRAI Data, the multi-SIM debunk on India 1 Billion Internet Users: The M2M Truth, and Tele-Density UP vs Delhi Comparison.
The 4 Most Common TRAI Reporting Mistakes
📊 The TRAI Data Interpretation Glossary for Marketers
| TRAI Reporting Metric | Common Misinterpretation | Accurate Statistical Meaning |
|---|---|---|
| Internet Subscribers | “Number of unique human internet users” | Total active SIM cards & wireline broadband lines |
| Tele-Density | “Percentage of citizens who own a phone” | Active telephone connections per 100 population (can exceed 100%) |
| UP Telecom Coverage | “Data for Uttar Pradesh as a single state” | Divided into two circles: UP East (includes Lucknow) and UP West |
| City-Level Data | “TRAI reports 5M users in Lucknow city” | TRAI provides zero city data; only Metro & Circle aggregates exist |
Press Release vs. Full QPIR: Which Should You Use?
TRAI releases two formats of telecom intelligence:
- Monthly Telecom Subscription Press Release (e.g. PR 104/2026): Published monthly, this 15-page document provides high-level operator market share (Jio, Airtel, Vi, BSNL) and wireless vs wireline totals. Great for quick news updates.
- Quarterly Performance Indicators Report (QPIR): Published quarterly with a 3–4 month audit lag, this 200+ page comprehensive document contains circle-level internet subscriptions, rural vs. urban splits, average data usage per user per month (GB), and revenue per user (ARPU). This is the gold standard for strategic planning.
To discover additional government databases, explore our directory of Free India Data Sources for Marketers.
Learn data-driven marketing analytics and campaign execution at US Soft Lucknow.
Frequently Asked Questions (FAQ)
Does TRAI provide city-level internet data for Lucknow?
No, TRAI does not publish city-level data. Telecom data in Uttar Pradesh is reported under two licensed service areas: UP East (which covers Lucknow) and UP West.
What is the difference between tele-density and internet penetration?
Tele-density measures total active SIM connections per 100 inhabitants, which can exceed 100% due to dual SIM cards. Internet penetration measures unique humans with access to the internet.